環球個人投資者調查報告

MONEX 環球個人投資者調查報告

2018年06月

[此調查報告只提供英文版本]
Executive Summary

Yutaka Masushima, Market Analyst, Monex Inc.


The world's major stock markets have experienced significant corrections since February this year but are gradually recovering. The Dow Jones Industrial Average and Germany's DAX have almost returned to pre-correction levels, but the Nikkei Stock Average and China's SSE Composite Index have been slow to recover (see graph).

In our twenty-fifth Monex Global Retail Investor Survey, investment sentiment deteriorated sharply among retail investors in all three regions due to the stock market corrections. However, one feature of the survey findings was that expectations for U.S. stocks increased, reflecting a comparatively quick stock market recovery and firm business conditions.

We also continued to ask retail investors about their experiences investing in cryptocurrency. Our finding that the percentage of retail investors in US and Japan answering that they had already invested in cryptocurrency increased from the previous survey was very interesting. We ask investors from around the world about their experiences investing in cryptocurrency at almost the same time and there is no other survey of this kind. We were able to obtain information that will be very useful when considering the potential future spread of cryptocurrency.

With your assistance, we have been able to compile and analyze extremely valuable data. We greatly appreciate your cooperation and hope that this survey will be of some aid in your investment decisions.


(Written as of June 5, 2018)
Summary
  1. Global Survey Results: Survey of Retail Investors in Japan, U.S. and China (H.K.)

    (1-1) The forecast DI (*) for world stock markets fell sharply in all three regions.

    We asked retail investors in each region about their views on world stock markets for the coming three months. In all three regions, the DI fell sharply from the previous survey (conducted between November and December 2017). Especially among retail investors in U.S. and China (Hong Kong), the DI showed a substantial decrease of 30 points and 48 points respectively. The results suggest that the global stock market correction seen since the start of the year worsened sentiment among retail investors.

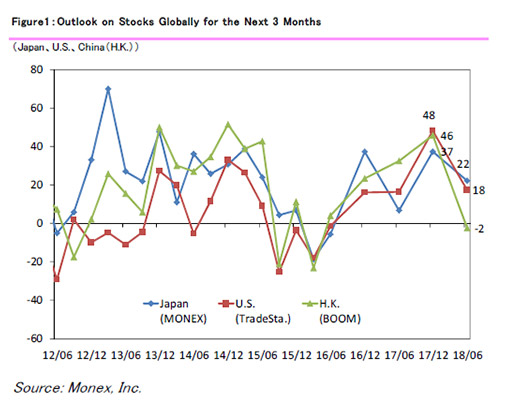
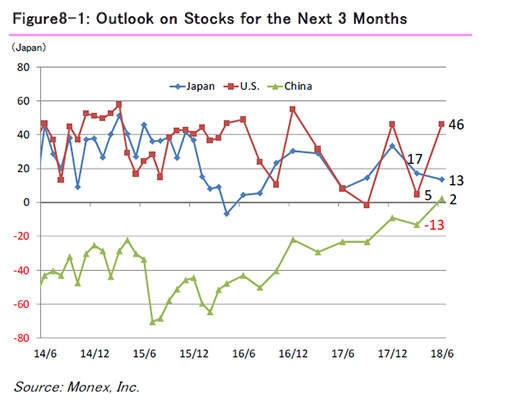
    [The forecast DI for world stock markets]

    [Japan]
    Dec. 2017: 37 → June 2018: 22 (-15 points)
    [U.S.]
    Dec. 2017: 48 → June 2018: 18 (-30 points)
    [Forecast DI: China (H.K.)]
    Dec. 2017: 46 → June 2018: -2 (-48 points)


    * DI (diffusion index): The percentage of respondents who answered "will rise or improve" minus the percentage of respondents who answered "will fall or deteriorate."


    (1-2) Expectations for U.S. stocks increased among retail investors in all three regions.

    Retail investors in all three regions answered that U.S. was the region where there is the greatest likelihood of stock price appreciation in the coming three months. Furthermore, among retail investors in all three regions, expectations for U.S. stocks increased from the previous survey. The rise in expectations for U.S stocks is thought to reflect the fact that business conditions in U.S. are firm compared to the other regions and the recovery in stock prices was also comparatively quick.

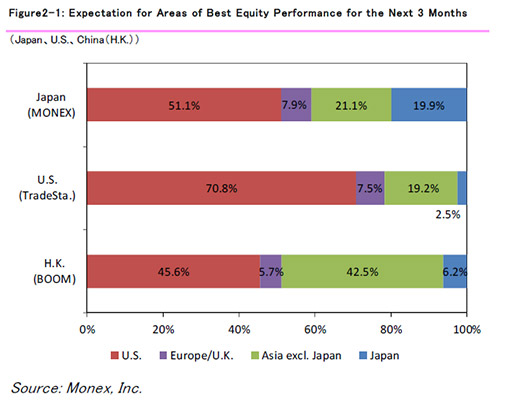
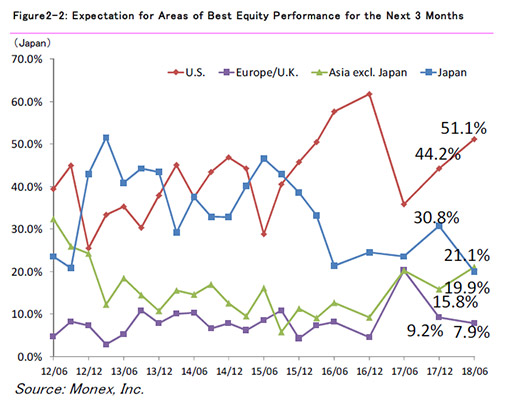
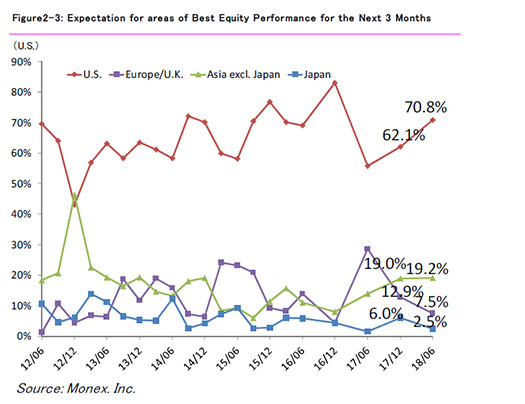
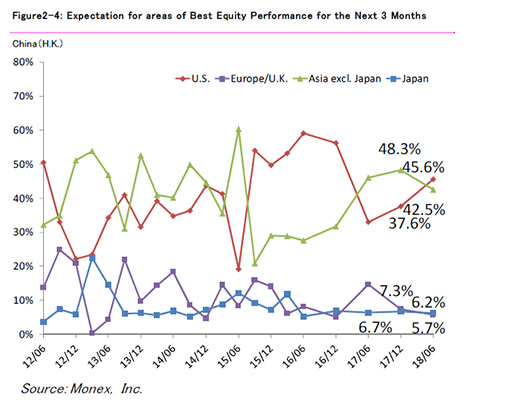
    [Expectations for stock markets in the coming three months]

    [Japan]
    U.S.: 51.1%
    Europe/U.K.: 7.9%
    Asia excl. Japan: 21.1%
    Japan: 19.9%
    [U.S.]
    U.S.: 70.8%
    Europe/U.K.: 7.5%
    Asia excl. Japan: 19.2%
    Japan: 2.5%
    [China (H.K.)]
    U.S.: 45.6%
    Europe/U.K.: 5.7%
    Asia excl. Japan: 42.5%
    Japan: 6.2%


    (1-3) The percentage of retail investors expecting a stronger dollar increased in U.S. and China.

    In both U.S. and China (Hong Kong), the currency that retail investors consider most likely to increase in value in the coming three months was U.S dollar and the percentage of retail investors in both regions who answered so rose from the previous survey.
    The percentage of retail investors in Japan who forecast a weaker yen against the dollar in the coming three months was 45%, rising sharply from 33% in the previous survey (conducted in March 2018).


    *Figure 3-1 shows a comparison with the previous survey (between May and June 2017) for retail investors in U.S. and China (Hong Kong). Figure 3-2 shows changes in USD/JPY forecast among Japanese retail investors from December 2012 to the present. Japanese retail investors were surveyed every month from the start of the survey to April 2016, every two months from June 2016 to December 2016, and every quarter from March 2017 to the present.


    (1-4) On the list of most attractive sectors, "Technology" continued to rank top in all three regions.

    As in the previous survey, "Technology" continued to be ranked in the top on the list of the most attractive sectors among retail investors in Japan, U.S. and China (Hong Kong). The evolution of AI and the emergence of various products using the latest technologies such as AR (augmented reality) and VR (virtual reality) are no doubt fueling high expectations among investors.


    *Figure 4-1 shows a comparison of rankings with the previous survey (conducted between May and June 2017) for retail investors in U.S. and China (Hong Kong). Figure 4-2 shows changes in the ranking among Japanese retail investors from June 2013 to the present. Japanese retail investors were surveyed every month from the start of the survey to April 2016, every two months from June 2016 to December 2016, and every quarter from March 2017 to the present.


    (1-5) Results for the Crude Oil DI were mixed despite sharply rising crude oil futures prices.

    Results for the Crude Oil DI were mixed, with the DI rising substantially among retail investors in U.S., dipping slightly in China (Hong Kong), and falling sharply in Japan. Despite a recent minor correction, crude oil WTI futures prices have risen sharply, temporarily hitting around 75 dollars per barrel compared to around 60 dollars per barrel at the end of last year, and the results reflect different assessments of the rise in each region. The Crude Oil DI for retail investors in Japan was -5, the first negative result recorded since the survey conducted in December 2015.

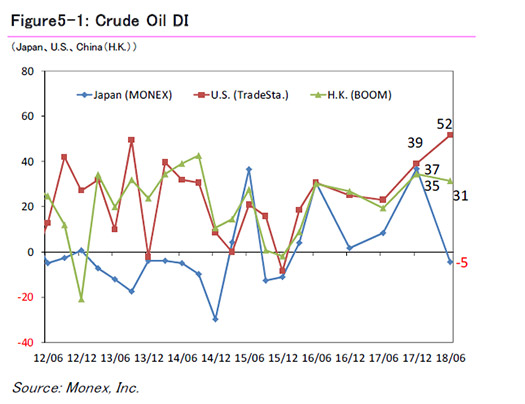
    [Expectations for Crude Oil]

    [Japan]
    Dec. 2017: 37 → June 2018: -5 (-42 points)
    [U.S.]
    Dec. 2017: 39 → June 2018: 52 (+13 points)
    [China (Hong Kong)]
    Dec. 2017: 35 → June 2018: 31 (-4 points)
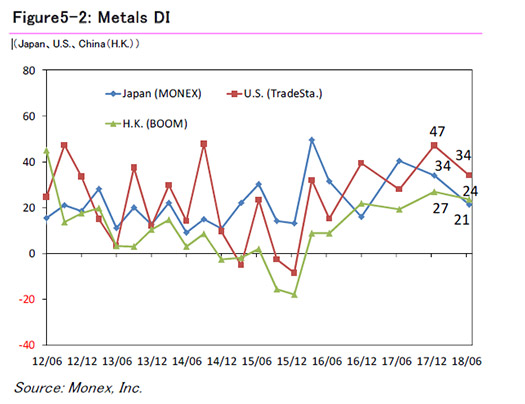
    [Metals]

    [Japan]
    Dec. 2017: 34 → June 2018: 21 (-13 points)
    [U.S.]
    Dec. 2017: 47 → June 2018: 34 (-13 points)
    [China (Hong Kong)]
    Dec. 2017: 27 → June 2018: 24 (-3 points)
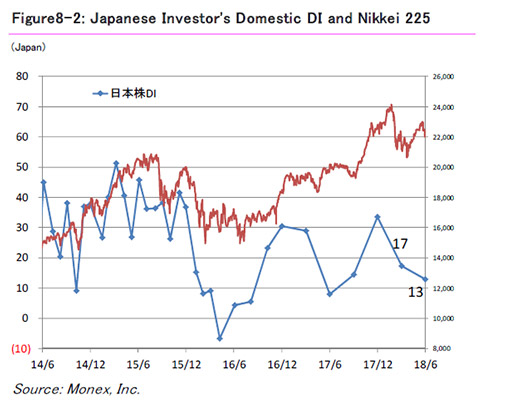


    (1-6) In contrast to the market view, the percentage of retail investors in Japan forecasting a further rate hike in U.S. in June was low.

    Although the FRB has announced another rate hike on 14 of June(Japan Time), our survey showed that the percentage of retail investors who answered that the timing of the FRB's next rate hike would be June 2018 was just above 20% in U.S. and Japan and just above 40% in China (Hong Kong), slightly lower than the market view.


    (1-7) Percentages of retail investors in Japan and U.S. investing in cryptocurrency reached their highest levels since the start of the survey.

    We asked retail investors about much-talked-about "cryptocurrency" such as bitcoins with respect to their experience and willingness of investment. The percentages of retail investors in U.S. and Japan answering that they had already invested in cryptocurrency reached their highest levels since introduction of this question in June 2017. Given that the last December survey was conducted by 1st of December, which was before the peak of the market, the number of investors in cryptocurrency market might have declined since the peak, but still, compared to the level of last year, retail investors investing in cryptocurrency becomes more widespread.


  2. Results

  3. Japan Quarterly Survey Results: Survey of Retail investors in Japan

    (2-1) The DI for U.S. stocks and Chinese stocks both rose, with the DI for Chinese stocks entering positive territory for first time in around six years.

    We asked Japanese retail investors about their outlook for the stock markets in Japan, U.S. and China in the coming three months. The DI for U.S. stocks and Chinese stocks both rose sharply from the previous survey (conducted in March 2018). The DI for U.S. stocks surged 41 points from the previous survey, and the DI for Chinese stocks turned positive for the first time in around six years since the survey conducted in February 2012. Expectations for Chinese stocks appear to be gradually increasing.

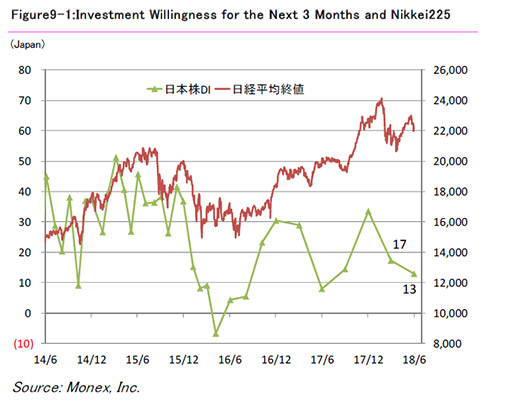
    [Japanese Stocks DI]
    March 2018: 17 → June 2018: 13 (-4 points)
    [U.S. Stocks DI]
    March 2018: 5 → June 2018: 46 (+41 points)
    [China stocks DI]
    March 2018: -13 → June 2018:2 (+15 points)


    (2-2) DIs for "trading frequency," "investment amount" and "number of stocks held" for Japanese stocks were mixed.

    Although the DIs for "trading frequency" and "investment amount" for Japanese stocks rose from the previous survey, the DI for "number of stocks held" fell slightly. With no major change in any of the DIs, the wait-and-see attitude about Japanese stock seems to be taking hold.

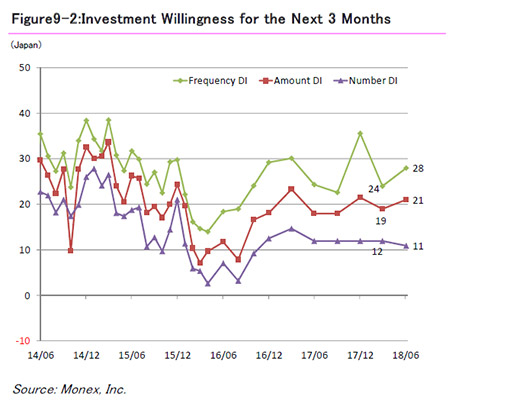
    [DI of trading frequency]
    March 2018: 24 → June2018: 28 (+4 points)
    [DI of investment amount]
    March 2018: 19 → June2018: 21 (+2 points)
    [DI of the number of stocks held]
    March 2018: 12 → June2018: 11 (-1 points)


    (2-3) Emerging country-related topics received more attention among Japanese retail investors.

    The topic that received the greatest attention among Japanese retail investors was "corporate earnings" in Japan. However, the percentage fell more than 5% from the previous survey. The topics that showed the biggest increase in attention compared with the previous survey were "emerging county (excl. China)" and "exchange rate trend." The sudden drop in the value of the Turkish lira attracted attention, and investors imagine that, as interest rates rise in U.S., the world's economic center, capital will flow back into the dollar, causing emerging market currencies to weaken, and this may explain the increased interest in these topics.


    (2-4) Almost half of the Japanese retail investors surveyed are against the planned consumption tax hike.

    We asked Japanese retail investors about the consumption tax hike planned for October 2019. When asked if they were for or against the consumption tax hike, almost half answered that they were against, whilst around 30% answered that they were for. Besides unease that the consumption tax hike will squeeze household budgets, many retail investors may be concerned that the consumption rate hike will lead to a economic slowdown in Japan, partly because there was a slump in consumption when the tax rate was raised from 5% to 8%.


Outline of Survey & Characteristics of Respondents

Japan

Method:
Online survey
Respondents:
Customers of Monex, Inc.
# of Responses:
532
Period:
May 28 to June 4, 2018.

United States

Method:
Online survey
Respondents:
Customers of TradeStation Securities, Inc.
# of Responses:
120
Period:
May 29 to June 1, 2018.

Hong Kong

Method:
Online survey
Respondents:
Customers of Monex Boom Securities (H.K.) Limited
# of Responses:
353
Period:
May 29 to June 1, 2018.

Disclaimer

The Monex Global Retail Investor Survey measures customer sentiment based upon answers to specific questions received from a random sampling of customers of Monex, Inc., TradeStation Securities, and Monex Boom Securities (H.K.) Limited. Details of the methodology used to conduct the survey are available upon request. Accuracy and completeness of the data derived from the survey are not guaranteed.

The Monex Retail Investor Survey has been published since October 2009, and the Monex Global Retail Investor Survey since June 2011.

* About the survey
- Monex Global Retail Investor Surveys were conducted every quarter from June 2011 to June 2016, and every six months from June 2016.
- Retail investor surveys limited to Japan were conducted every month from October 2009 to April 2016, every two months from June 2016 to December 2016, and every quarter from March 2017 to the present.

The information contained herein should not be construed as investment research or an offer or solicitation to buy or sell securities, securities derivatives, or futures products or services. Investor sentiment derived from the survey responses is no guarantee of future performance or success.